Neural Nets · August 1, 2026
The neuron you can grab and drag
Pixel Predict turns "how does a neuron work" into something you can drag
with your mouse. Three sliders — red, green, blue — feed three named
hidden units (Brightness Detector, Warmth Detector, Dominant Color
Detector), each shown with its own weight, its own tanh math, and a
live number. Grab a neuron directly and drag it up or down, and the
perturbation propagates straight through to a final color guess with a
confidence percentage.
How this evolved
None of this arrived in one sitting — the shape changed a lot along the way.
Phase 1 — Kanban board (May 10). Started as a 6-column scrollable board: RGB Input → Luminance → Scaled → Tanh → Hidden Layer → Output Prediction. Built in 9 passes — sliders, neurons, softmax output, beginner/advanced modes, and a "Break the model" button.
Phase 2 — Named detectors (May 10, afternoon). Restructured the math around three named hidden units — Brightness Detector, Warm vs Cool Detector, Dominant Color Detector — instead of anonymous neurons. The board grew to 7 columns, plus animated signal lines and a grayscale luminance preview.
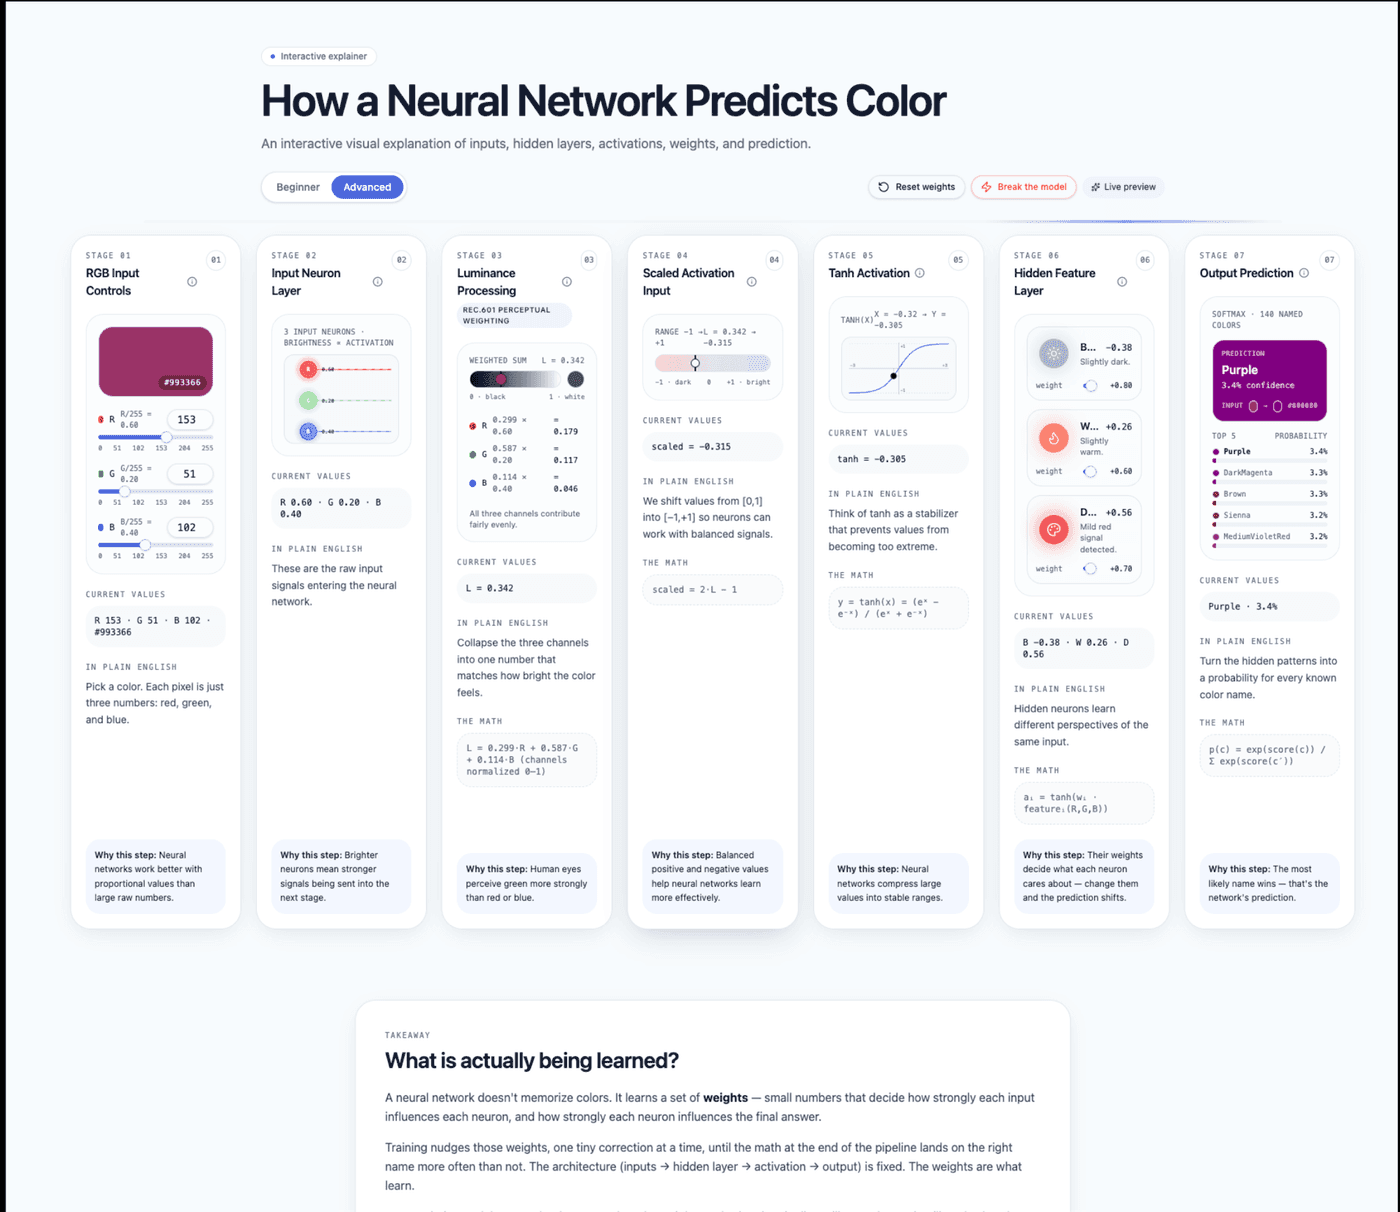
Phase 1–2: the original Kanban board — one card per pipeline stage.
Phase 3 — Single-screen graph (May 11). The Kanban felt cluttered, so it was replaced with a single always-visible SVG network graph and a thin stepper underneath — more minimal, less scrollable board. The old Kanban components stayed in the source, just unmounted.
Phase 4 — Accuracy and polish (May 11–12). Fixed the graph to match the real math (brightness from scaled luminance, warmth from raw R−B, dominant color from raw RGB), then a long pass of UX refinements: sliders moved outside the canvas, progressive reveal (past steps dim, future steps ghost), better spacing, full color labels, a bigger confidence number, and denser stage notes.
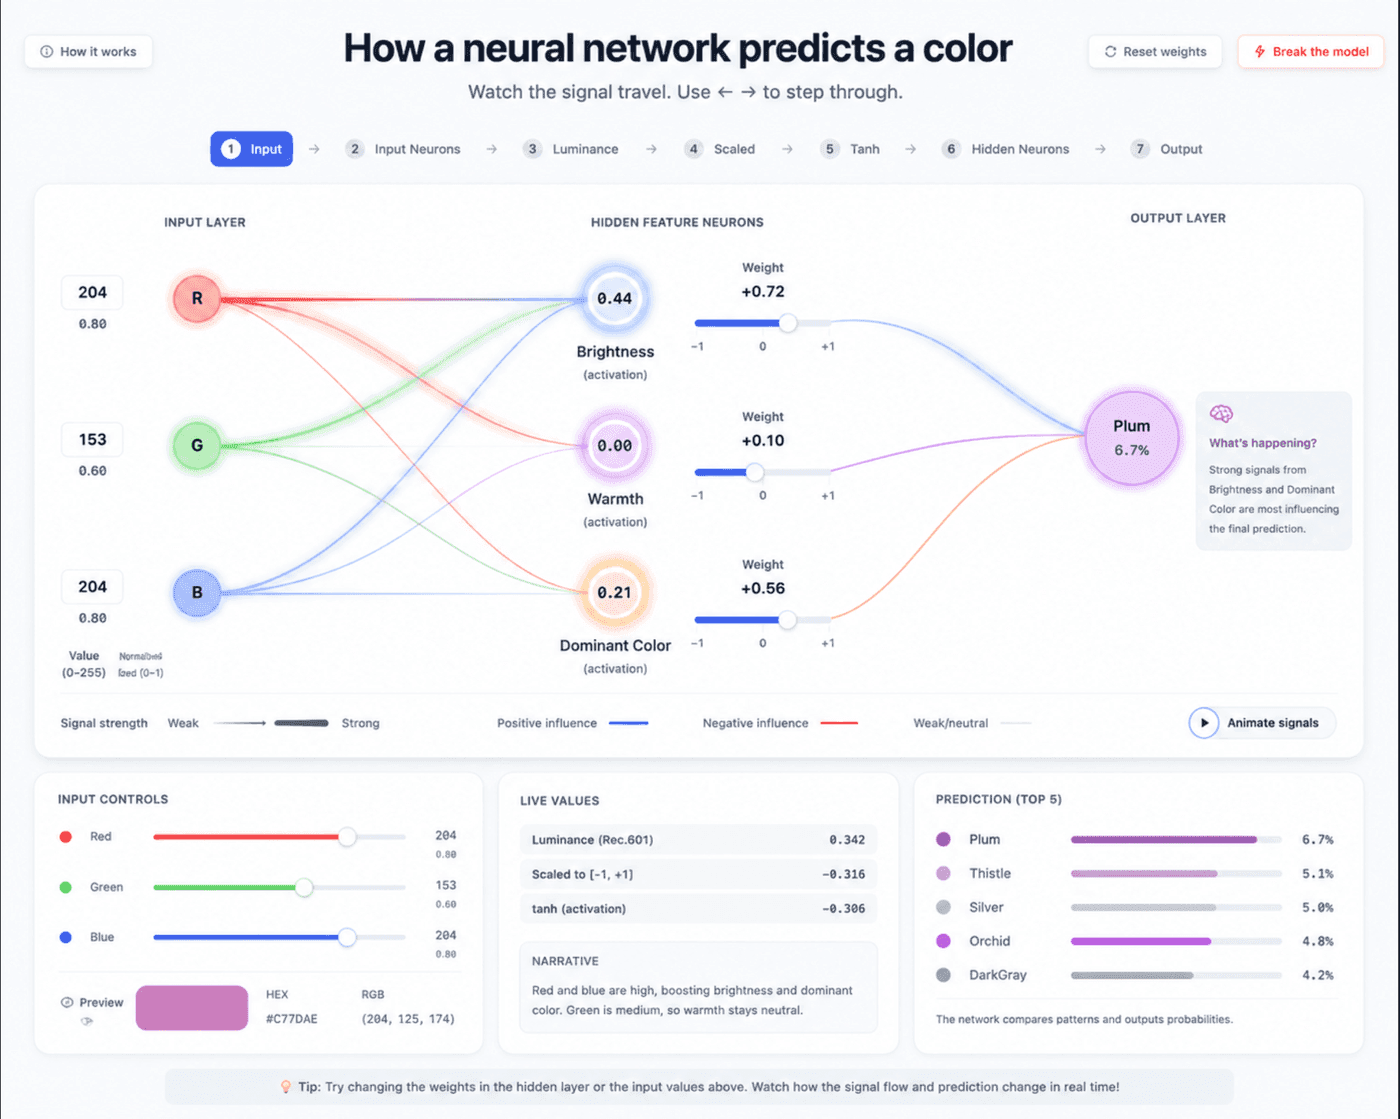
Phase 3–4: the Kanban replaced by one always-visible graph.
Phase 5 — Reframing the purpose (May 15–16). Retitled to "How a Neural Network Makes a Prediction" with an explicit intro explaining color is just the teaching vehicle. Renamed "Hidden Feature Neurons" to "Hidden Layer Neurons," expanded the stepper to the current 7 stages, and added a "Show advanced details" toggle so formulas stay hidden by default.
Phase 6 — Gated walkthrough (May 17). Turned the page into a locked/unlocked guided tour — intro, then the 7-step pipeline, then the full network — each section requiring the one before it to be acknowledged first.
Phase 7 — Unlocking earlier (Aug 1 — today). The full network panel staying locked until the very last step wasn't intentional. Changed the gating so "See the whole network" unlocks right after the intro and fills in progressively as you step through the pipeline, with multiple panels allowed open at once — the version tested below.
What makes it work
The neurons have names tied to what they actually compute, not "Neuron 1/2/3." Renaming a weighted sum "Warmth Detector" is a small trick, but it's the trick — it gives someone a mental model to hold onto instead of a black box.
What testing it turned up
Testing it against a handful of extreme inputs surfaced something the
demo doesn't say out loud yet: confidence isn't evenly distributed across
color space. Pure red comes back at 21.7%, pure blue at 40.5% —
genuinely confident, visibly glowing predictions. But pure white sits at
3.3%, pure black at 10.4%. The reason is architectural: two of the three
hidden units are literally defined as (R − B) and (max − avgOther) —
both zero whenever R=G=B. Every gray, white, or black input silently
loses two-thirds of its hidden layer. The "confident vs uncertain"
contrast the demo is built to teach only shows up for saturated colors;
grayscale is uncertain by construction, not by chance.
That's not really a bug — it's a fact worth teaching on purpose instead of leaving someone to stumble into it.
Want to see it in action? Try Pixel Predict for yourself.